News
£165 – the average we spend on housing a week
The average weekly amount spent on housing costs in the UK rose to £164.70 in the financial year ending 2016, according to figures just published by the Office for National Statistics on household spending in the UK.
The top three housing costs were mortgages (27%), net rent (20%) and other charges (18%), such as Council Tax and water charges.
Renting rising
Since 2006, there has been an increase in the number of rented households in the UK and a decrease in the number of houses being bought with a mortgage.
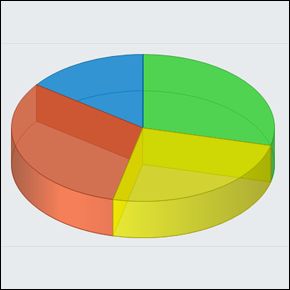
In 2015/16, the breakdown of different types of households was:
- Rented households (both private and social): 36%
- Mortgage held: 30%
- Owned the property outright: 34%.
The average weekly net expenditure for across all renting housholds was £92.00, accounting for 19% of a renting household’s total expenditure.
But average rent varies widely throughout the UK. The weekly amount spent on rent in London was £167.10, more than double the average in the majority of other regions, except the East of England, South East and South West.
Mortgage matters
The 2015/16 average weekly mortgage payment was higher than the average rent, at £147.60. Despite this, it only makes up 13% of total expenditure for mortgage holders. In other words, renters have less money left over to spend on goods and other services.
The survey also found that total average weekly household expenditure remained level at £528.90 in the financial year ending 2016 when compared with the same period a year ago.