Editor's Pick
Revealed: Property price hotspots over the last 10 years

Which areas have seen the biggest (and smallest) rises in house prices since 2012?
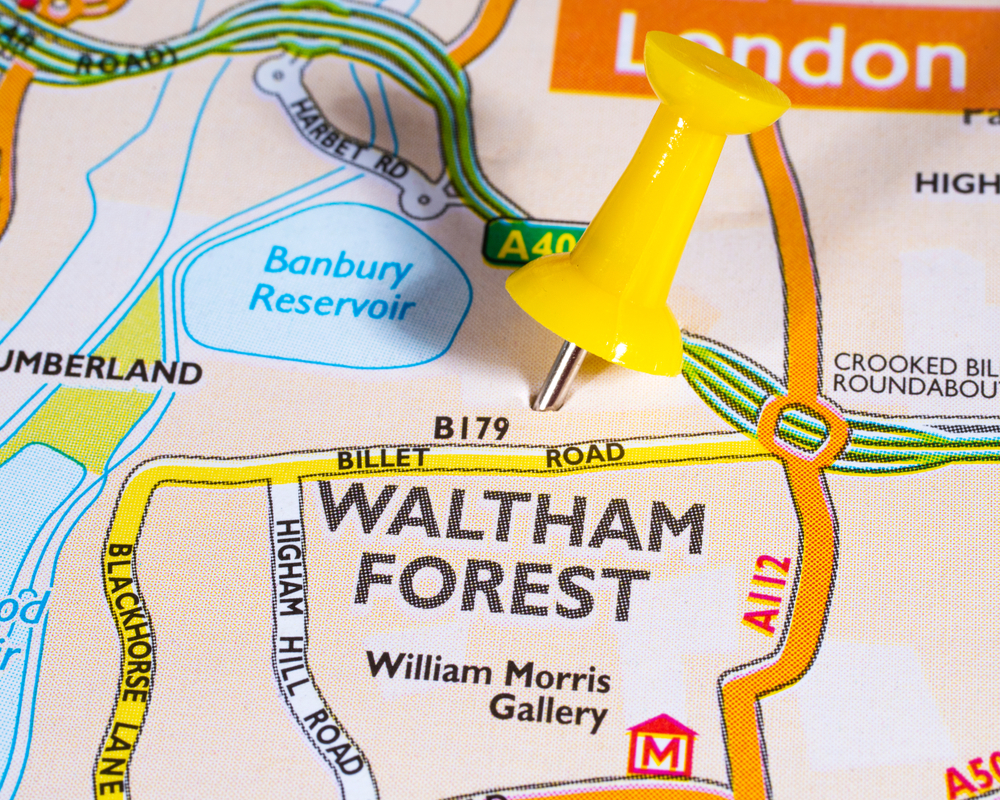
Waltham Forest in London has seen the greatest increase in property prices in the past decade, at 113.6%, according to CMC Markets.
The average house price there is now £484,229 compared to £226,741 10 years ago.
The online trading platform analysed house price data from the Office for National Statistics (ONS) for each local authority in the UK between 2012 and 2022 to find which areas saw the highest and lowest increase in house prices.
Thanet in Kent came second with a 111.9% increase in house prices, from £142,273 in 2012 to £301,510 in 2022.
Barking and Dagenham is the area with the third highest rise in property prices over 10 years, at 105.9%. In 2012, the average house price in Barking and Dagenham was £165,049.09 compared to £340,135.34 this year.
10 property hotspots over 10 years
1. Waltham Forest – 113.6%
2. Thanet – 111.9%
3. Barking and Dagenham – 105.9%
4. Hastings – 96.8%
5. Hackney – 96.5%
6. Medway – 95.7%
7. Dover – 95.0%
8. Bexley – 94.9%
9. Bristol – 94.7%
10. Thurrock – 94.4%
Worst returns in the last 10 years
The City of Aberdeen has seen the worst return on investment in the UK , being the only area to see a decrease in property prices over the past 10 years. In 2012, the average house price in the City of Aberdeen was £160,525 but has fallen by 9.9% to £144,614 in 2022.
The second lowest increase in house prices is in Inverclyde, with a 14.8% rise in the last decade. House prices in Inverclyde averaged at £100,389.36 in 2012 and have risen to £115,244.09 as of this year.
Aberdeenshire (the surrounding area of the city) has the third lowest increase in property prices in the last decade. There has been a 15.4% rise in house prices in the Scottish area in the past decade, from £173,885 to £200,590.
10 places with lowest house price inflation
1. City of Aberdeen – -9.9%
2. Inverclyde – 14.8%
3. Aberdeenshire – 15.4%
4. County Durham – 25.1%
5. Middlesbrough – 25.7%
6. Allerdale – 27.0%
7. Stockton-on-Tees – 27.7%
8. Angus – 28.1%
9. Carlisle – 29%
10. Preston – 30.3%